Beacon vs Telemetry: The 10-Minute Triage Method
Not all periodic traffic is C2. And not all C2 looks scary. This post gives a fast, practical method to separate beaconing from benign telemetry using only what most SOCs already have: timing, URI structure, headers, reputation context, and correlation to endpoint behavior. No lab needed. No PCAP required.

The moment every analyst hits
You are looking at proxy logs and you see it:
- Same host
- Same domain
- Same path
- Every 60 seconds
Your brain says: “Beacon.”
Then someone says: “That is just telemetry.”
And the argument begins.
The problem is that both sides are sometimes right. Modern software is chatty. EDR agents, browsers, collaboration apps, updaters, cloud services - they all phone home regularly. Attackers know that and build their C2 to blend into the noise.
So the question is not “Is it periodic?” The question is: Does this traffic behave like software, or like an operator?
Here is the method I use to answer that in about 10 minutes.
What you need (most SOCs already have this)
You do not need a full packet capture to do useful triage.
Minimum inputs:
- timestamps
- destination domain and URI path
- status codes and response sizes (if available)
- user-agent (if available)
- some endpoint context (process tree, recent downloads, persistence events)
If you have DNS telemetry and certificate metadata, even better - but not required.
The 10-minute method: score it like an analyst, not a tool
This is a quick scoring model. You are building a probability call, not a courtroom case.
Minute 1-2: Timing (does it look like a beacon?)
Ask:
- Is it regular (same interval)?
- Does it have jitter (small random variation)?
- Does it survive user inactivity and reboots?
Telemetry often:
- spikes on startup/login
- follows user activity
- has variable timing due to app behavior
Beaconing often:
- maintains cadence regardless of user activity
- uses jitter intentionally (55-75 seconds, not exactly 60)
- continues even when the user is not doing anything
A single periodic pattern is not enough, but it is the first signal.
Minute 3-4: Structure (does it look like an API, or a check-in?)
Look at the URI path and query strings.
Telemetry often:
- has long, descriptive paths (versioned API endpoints)
- includes obvious parameters (device id, build, platform)
- uses readable JSON or known patterns
Beaconing often:
- uses short, repeatable endpoints:
/v1/,/api/,/connect,/check,/sync - includes opaque identifiers:
id=,sid=,token=, base64-like blobs - repeats the same path across time with minor variations
Two practical tells: 1) The endpoint name feels generic (“connect”, “check”, “update”) with no product context. 2) The query string is mostly opaque.
Minute 5: Response behavior (small replies, predictable sizes)
If your telemetry includes response size or a proxy “bytes in/out”:
- Small, consistent replies over time is common for beacons.
- Telemetry often has more variable payload sizes.
Red flags:
- almost identical response sizes
- frequent 200 OK with tiny content
- repeated redirects that establish a loop
Again, not definitive - but useful.
Minute 6: Identity (does the domain make sense for the environment?)
This is where analysts get lazy and jump straight to “new domain = bad”. Do not do that.
Instead ask:
- Is this a known vendor domain for software we actually run?
- Is it a CDN domain that matches expected products?
- Is the domain name shaped like a brand impersonation?
Examples of suspicious domain “shape”:
- vendor-ish words plus fillers:
cdn-checker,update-service,verify-cdn - strange TLD choices for enterprise software
- recently registered or low-reputation hosting (if you can check quickly)
A domain can be new to your environment and still be benign. But a domain can also be old and still be malicious. Treat this as context, not verdict.
Minute 7-8: Correlation (the part that ends debates)
Now connect network behavior to endpoint behavior within the same time window.
If you see periodic traffic AND any of the following around the first-seen timestamp, you are no longer debating telemetry:
- a fresh download execution from Downloads or Temp
- suspicious process chains (PowerShell encoded, mshta, wscript, rundll32, regsvr32)
- persistence creation (scheduled task, Run key, service install)
- credential store access (browser DB access, DPAPI activity, unusual file reads)
This correlation step is how you avoid arguing based on vibes.
If the traffic begins immediately after a suspicious execution chain, it is probably not harmless telemetry.
Minute 9-10: Make the call and write down why
Do not end with “maybe”.
End with:
- “Likely telemetry” OR “Likely beaconing” OR “Indeterminate”
- What would change your confidence (one or two things)
That is professional tradecraft: a decision plus the evidence basis.
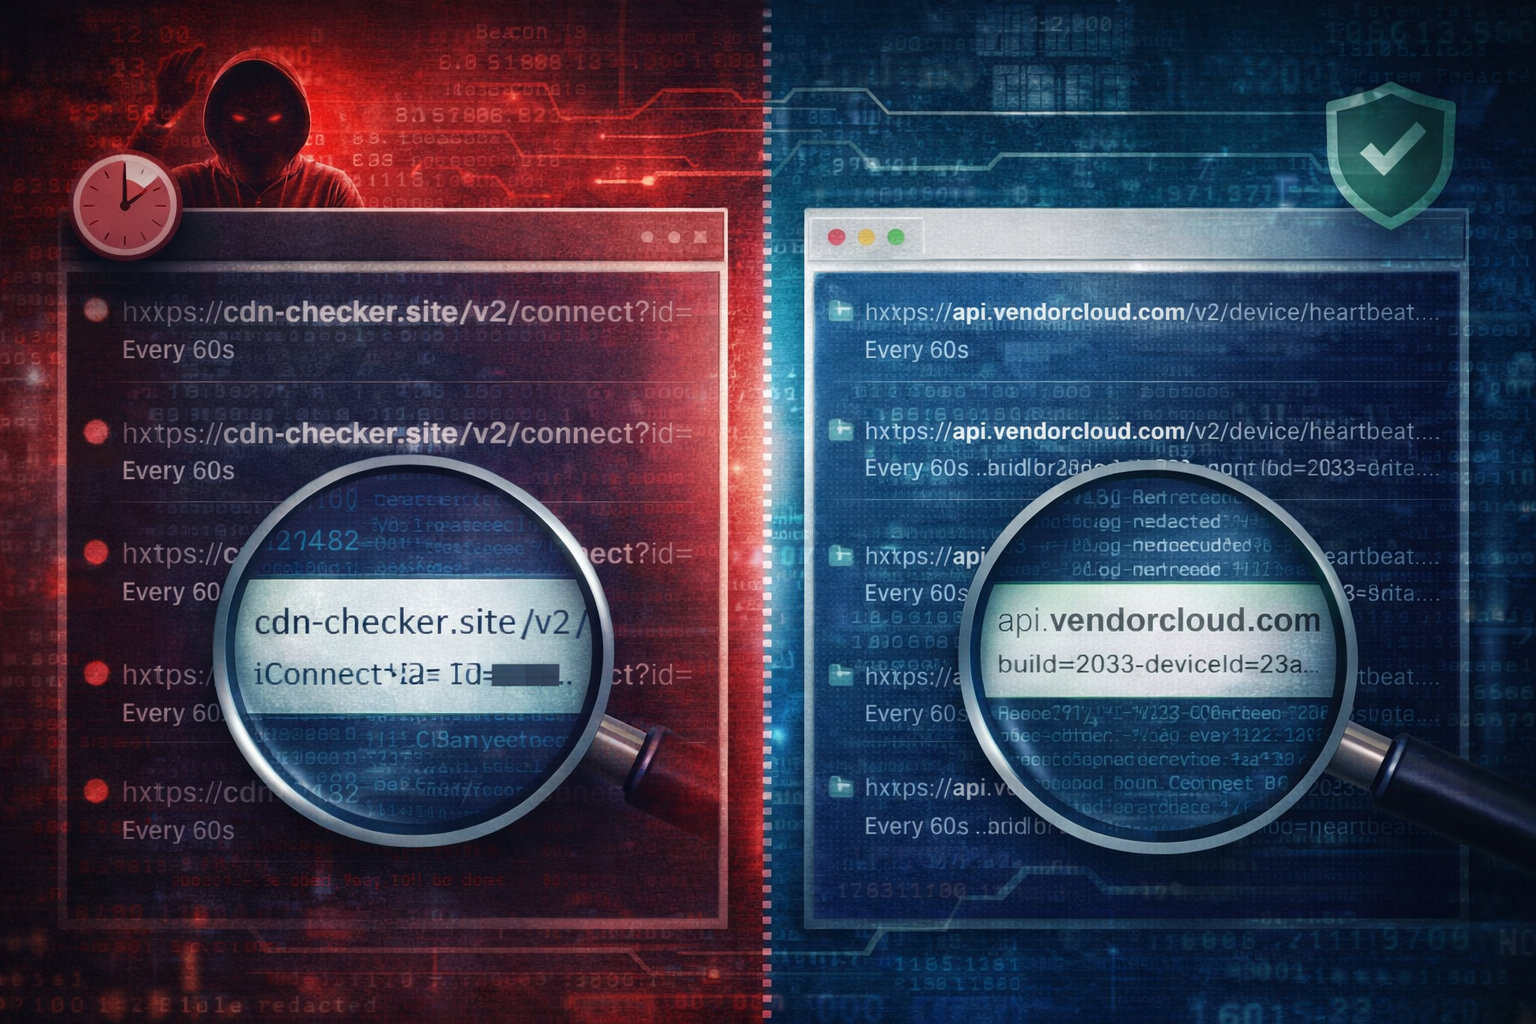
Worked example: two patterns that look identical at first glance
Pattern A: benign telemetry (but noisy)
- Domain:
api.vendorcloud.com - URI:
/v3/device/heartbeat?deviceId=<guid>&build= - Timing: periodic but spikes on login
- Endpoint context: no unusual process activity, no new persistence
Result: likely telemetry.
Pattern B: beaconing disguised as telemetry
- Domain:
cdn-checker.site - URI:
/v2/connect?id=<opaque> - Timing: steady every ~60s with small jitter
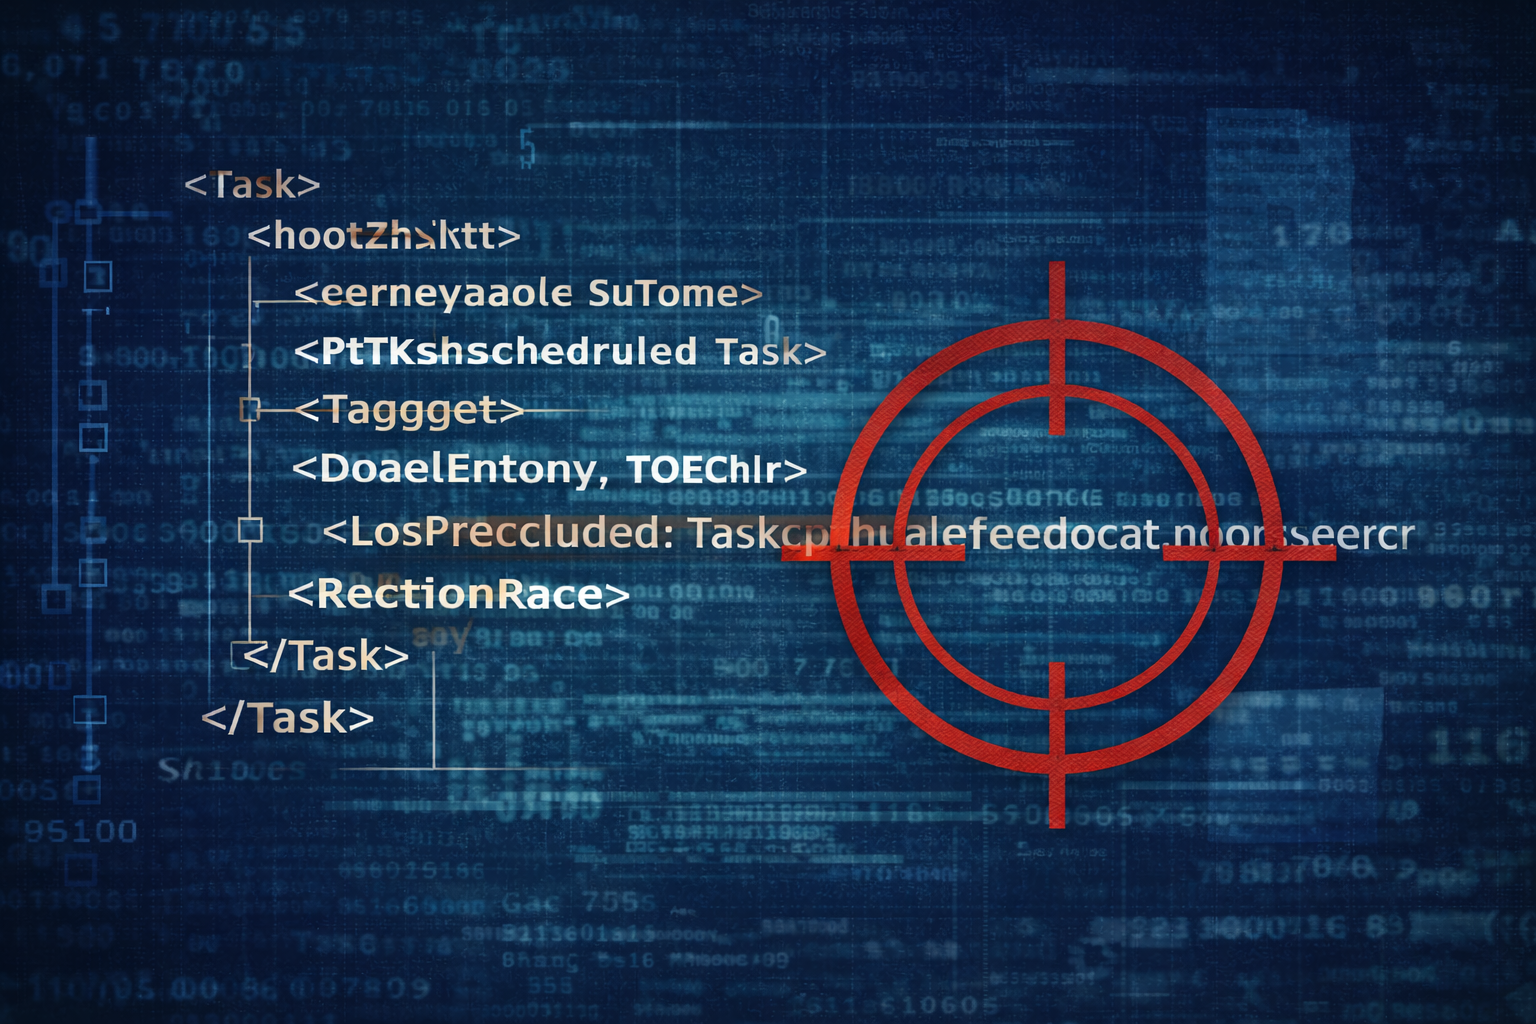
- Endpoint context: new scheduled task created 2 minutes before beacons began,
rundll32executed from user profile
Result: likely beaconing.
Same periodicity. Different story.
What to do once you suspect beaconing (without overreacting)
1) Contain the host or restrict egress (depends on environment) 2) Preserve evidence: process tree, persistence artifacts, DNS/proxy history 3) Scope: search fleet-wide for the same domain and URI pattern 4) Hunt around the first-seen time for the execution chain that started it
If you treat suspected C2 as a purely network problem, you will miss the host story that matters.
Common mistakes that waste time
- Declaring C2 based only on periodic timing
- Declaring telemetry based only on “it is HTTPS”
- Ignoring endpoint correlation because it is “a network alert”
- Failing to document what evidence would confirm or disprove
Artifact Annex (field notes)
Network pivots
- Domain + first-seen time
- URI structure + query string shape
- cadence and jitter (rough interval is fine)
- response size patterns (if available)
- user-agent consistency (if available)
Host pivots
- new downloads executed near first contact
- LOLBin execution patterns
- persistence creation within +/- 10 minutes
- browser credential store access after beacons begin
Detection ideas
- Correlate: new domain + periodic connections + recent task creation
- Alert: first-seen domain contacted within minutes of encoded PowerShell/rundll32
- Hunt: same URI path across multiple endpoints (often reveals campaign spread)


