First 10 Minutes: How I Triage Malware (Under Pressure)
This is not a perfect-world DFIR process. It’s what I do in the first 10 minutes when an alert hits and the clock is ticking: capture the hinge artifacts, decide whether to contain, and set up pivots for scoping. Written as a lab note story with the exact questions I ask myself and the evidence I grab first.

Minute 0: The alert lands
It is always something small.
A single host. A single user. A single “weird” event.
This time it’s a workstation that just contacted a domain the environment hasn’t seen before. The proxy logs show a neat cadence. Every minute. Like a metronome.
Someone pings: “Could be beaconing.”
Someone else: “Probably telemetry.”
I open the case. I start the clock.
Because the first 10 minutes are where you either:
- capture what matters, or
- lose it to reboots, containment actions, and panic.
Minute 1: I name the problem
Before I look at a single log line, I decide what I’m trying to answer.
Not “what malware family is this?” Not “what does VirusTotal say?”
The first question is always:
“Do I need to contain this host right now?”
Everything I do in the next 10 minutes is in service of that.
Minute 2: I grab the hinge timeline (20 minutes, no more)
I pull a tight time window around the first weird event:
- 10 minutes before
- 10 minutes after
The goal is not full history. The goal is to catch the hinge—the moment normal activity turns into intrusion.
In that window, I look for:
- downloads and first execution from user-writable paths
- sudden LOLBin activity (PowerShell, cmd, mshta, rundll32)
- persistence creation (tasks, Run keys, services)
- first outbound beacons to new infrastructure
If I find nothing unusual in that window, it’s probably not an incident.
If I find even two of those, the conversation changes.
Minute 3: I identify the process that started it
If I can’t answer “what process initiated the suspicious behavior,” I’m blind.
So I build a fast process story:
- what executed?
- what spawned it?
- where did it execute from?
- what did it spawn next?
The fastest “red flag chain” in real environments looks like:
- user executes a file from Downloads
- cmd/PowerShell appears
- rundll32 executes a DLL from AppData
- something persists
It is not always that neat, but when it is, you don’t debate it.
Minute 4: I check where the payload lives
Location is a truth serum.
If the payload is running from:
C:\Users\<user>\Downloads\C:\Users\<user>\AppData\Roaming\C:\Users\<user>\AppData\Local\Temp\
…my suspicion increases fast.
Legitimate enterprise software usually runs from stable vendor directories, not newly created folders in a user profile.
I note:
- file path
- creation time
- signer status (if available)
- hash (if I can capture it fast)
Minute 5: I look for persistence (because that’s the point of stage 1)
Loaders don’t exist to be interesting. They exist to survive and fetch stage 2.
So I hunt for persistence artifacts early:
- scheduled tasks
- Run keys
- services
- startup entries
If a scheduled task appears within minutes of suspicious execution, I treat it as a strong signal. Especially if the action points to user-writable paths or uses LOLBins.
When I see it, I export what I can (task details, XML). Evidence first. Cleanup later.
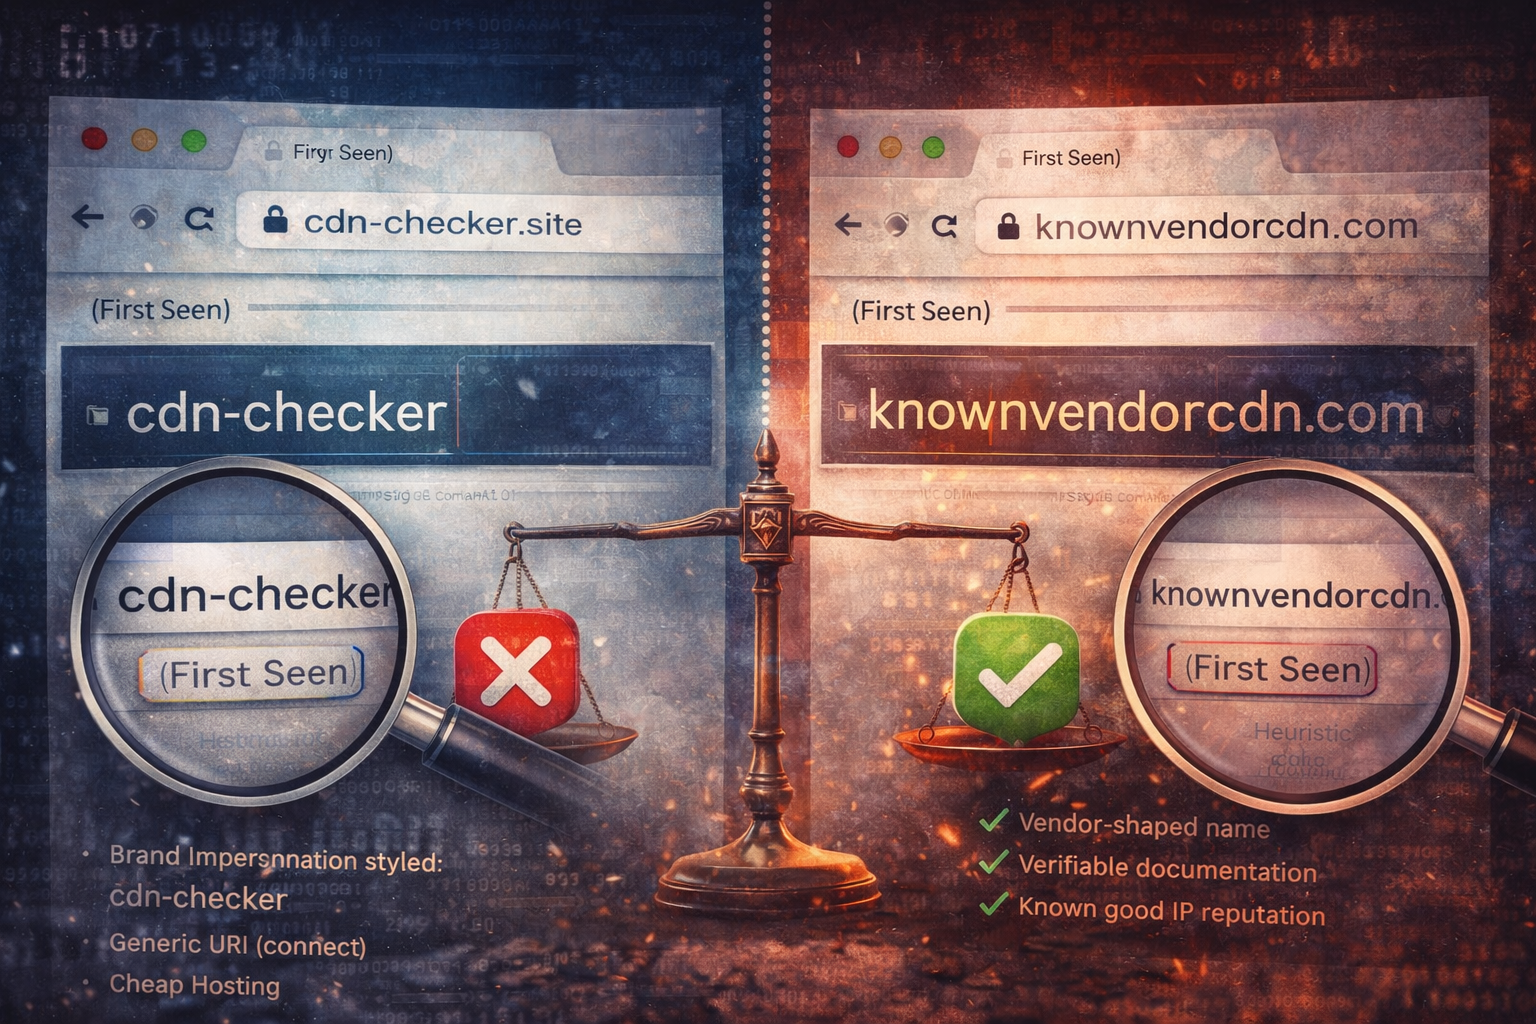
Minute 6: I decide whether the network pattern is “software” or “beacon”
Now I go back to the thing that triggered the case: the traffic.
I check:
- cadence (regular? jitter?)
- URI structure (generic “connect/check” endpoints?)
- response size patterns (tiny, consistent replies?)
- first-seen domain context (does it match a vendor we run?)
But here’s the trick:
I don’t let the network decide the case alone.
I correlate it to what I just found on the host.
If beaconing starts right after a suspicious execution chain and persistence appears:
- I stop arguing about telemetry.
- I start planning containment.
Minute 7: I take a quick look for objective signals
At this point, you often already know “loader.”
But the next question is: “What is it trying to do?”
For common intrusions, objective signals show up quickly:
- browser credential store access (
Login Data,Cookies,Local State) - LSASS access attempts (varies by environment)
- new remote logons / lateral movement hints
- archive creation and outbound transfer patterns
You don’t need to confirm exfiltration to respond. But if you see credential store access after beaconing begins, your response expands to include session and token hygiene.
Minute 8: I scope for siblings
One host is rarely the full story.
So I pivot across the environment with the fastest, highest-signal pivots:
- scheduled task name/action pattern
- DLL path and hash
- domain + URI structure
- distinctive command lines (encoded PowerShell, rundll32 export)
If I find a second host with the same persistence or same URI pattern, I escalate quickly.
Because now it is no longer “a weird host.” It is spread.
Minute 9: I write the one-paragraph call
This is the thing that keeps everyone aligned:
- what we observed (facts)
- what we assess (judgment)
- what we are doing now (action)
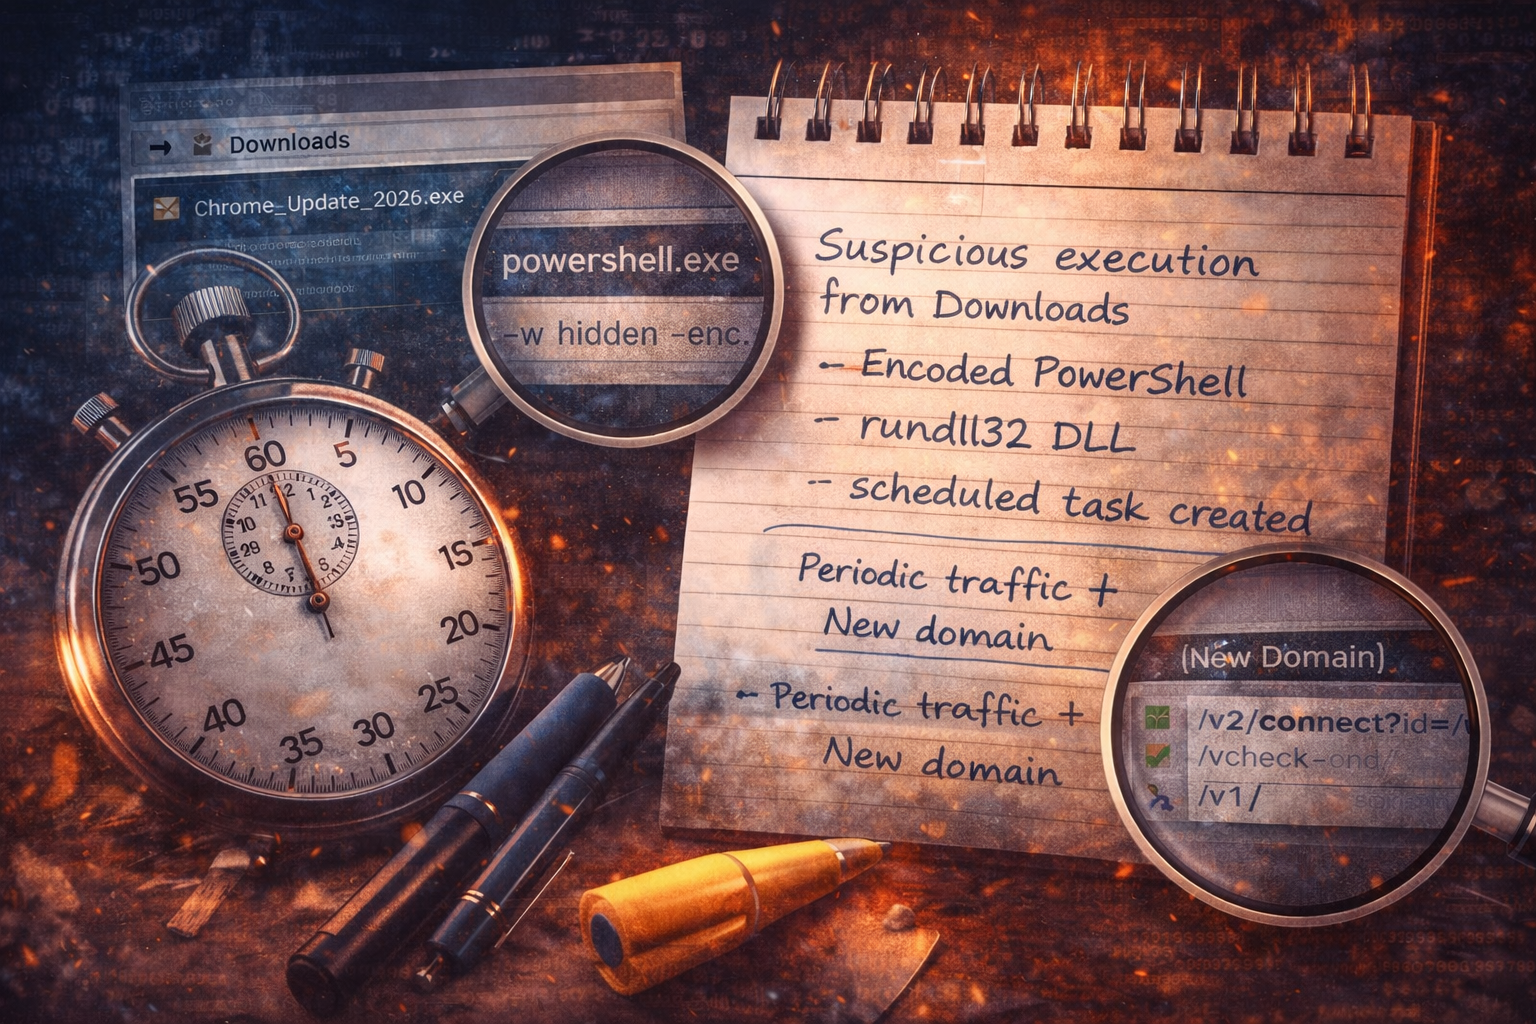
Example format:
Observed suspicious execution from Downloads followed by encoded PowerShell, DLL execution via rundll32 from AppData, and creation of a scheduled task for persistence. Shortly after, the host initiated periodic outbound HTTPS connections to a first-seen domain with a stable check-in endpoint. This is consistent with a loader infection chain; containment and fleet scoping are recommended.
This paragraph is what you paste into tickets, chats, and updates.
Minute 10: Contain or monitor (I choose early containment when the chain is clear)
If I have:
- suspicious execution chain, AND
- persistence, AND
- new periodic outbound traffic
…that is enough for containment in most environments.
Because the cost of waiting is high:
- credential theft
- access brokerage
- follow-on payloads
- lateral movement
Loader stage is where you can still stop it cheaply.
The checklist version (because you’ll want it)
In the first 10 minutes, I aim to answer:
1) What was the first unusual event, and when?
2) What executed, from where, and who spawned it?
3) Did it create persistence?
4) Did it start outbound communications?
5) Is there a signal of objective (credential stores, token abuse)?
6) Can I find a sibling host with the same pivots?
That’s it. Everything else can come later.
Artifact Annex (field notes)
Must-capture artifacts
- first-seen domain + URI structure + timestamps
- process tree + command lines
- payload path + creation time + hash
- persistence details (task XML if possible)
- objective signals (browser store access, suspicious archive creation)
High-signal pivots
- scheduled task action points to user-writable paths
- rundll32 executing a new DLL from AppData
- new domain beaconing starting within minutes of execution chain